Description
After completing the Excel beginners courses you’ll explore more complicated ways of graphing and charting data, including more than one set of data. This Excel charting course also includes presentation and formatting skills to make your charts more professional for inclusion in reports and other corporate documents.
Excel Graphs and Charting Course includes:
- Charting: Creating a simple chart and learning that charts are dynamic and based up on the information stored somewhere else within the spreadsheet, Inserting labels for heading, the x & y axis, values and more. Learning how to chart multiple rows and columns
- Charting: Organising your sheet tabs, especially for new chart sheets, changing the data range within the chart wizard, charting several separate data ranges, charting options and different types of charts (pie charts)
- Chart formatting: Understanding chart objects for the purpose of formatting, understanding the buttons in the chart toolbar, and using right-click to format. Formatting a data series, and parts of a pie chart, having 2 different data formats within the one chart and how to get charts into Microsoft Word documents.
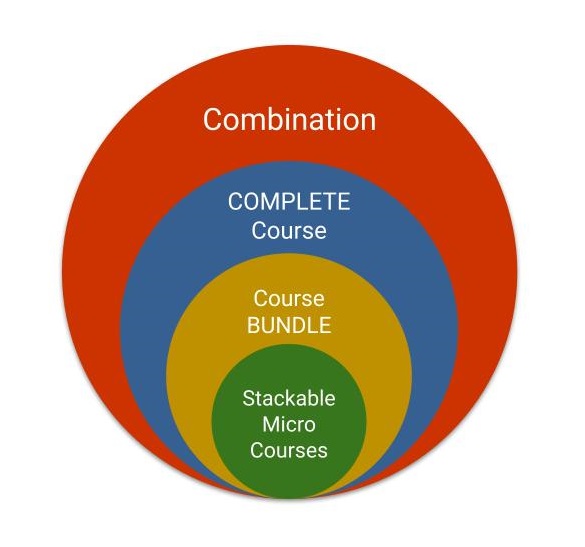
This Microsoft Excel Charting Micro Course is included in the Microsoft Excel Intermediate Training Course Bundle and Excel COMPLETE Training Course Package